


In pharmacology, studying how a drug interacts with body tissues or organs helps us understand its efficacy, potency, and safety. One of the most important method to study how a drug interacts with body tissues or organs in this analysis is the Dose response curve. This curve provides a visual representation of how the biological response of a tissue changes with varying drug concentrations.
Let's explore what a Dose Response Curve is, how it's obtained, and why it's essential in experiments involving tissues like the frog rectus abdominis muscle or abdominis rectus muscle.
What is a Dose Response Curve?
A Dose Response Curve is a graphical representation that shows the relationship between the concentration or dose of a drug and the magnitude of response it produces.
On the X-axis, the concentration or dose of the drug is plotted (often on a logarithmic scale).
On the Y-axis, the response or effect (such as muscle contraction, enzyme activity, or receptor activation) is plotted.
This curve helps pharmacologists determine the threshold dose, maximum response (Emax), and potency (EC50) of a drug—key parameters in understanding drug action.
Experimental Model: The Frog Rectus Abdominis Muscle
The frog rectus abdominis muscle (often simply called the abdominis rectus muscle) is a classic preparation used in pharmacological experiments to study the effects of drugs on smooth muscle contraction.
Because this muscle contains receptors that respond to neurotransmitters like acetylcholine, it's an excellent model for constructing Dose Response Curves.
In a typical experiment:
The isolated frog rectus abdominis muscle is mounted in an organ bath containing Ringer's solution.
Drugs are added in increasing concentrations.
The strength of contraction is recorded after each addition.
The responses are plotted to obtain a log dose-response curve.
Common Drugs Used in Dose Response Curve Experiments
Several pharmacological agents are commonly studied using the frog rectus abdominis muscle:
Acetylcholine (ACh): A neurotransmitter that stimulates muscle contraction by acting on muscarinic receptors.
Acetylcholine meaning: It is a chemical messenger that transmits signals across synapses, especially in the neuromuscular junction.
Adrenaline: Also known as epinephrine, it acts on adrenergic receptors and may relax or contract smooth muscle depending on the receptor subtype.
Histamine: Causes contraction of smooth muscles by acting on histaminergic receptors.
Barium Chloride: A non-specific smooth muscle stimulant that directly depolarizes the muscle membrane, causing contraction.
Physostigmine: An anticholinesterase drug that inhibits acetylcholinesterase, thereby increasing the concentration of acetylcholine at the receptor site.
Physostigmine uses: It is used in pharmacological research to potentiate acetylcholine responses and in medicine to treat glaucoma and anticholinergic toxicity.
Interpreting the Dose Response Curve
The shape of the curve provides valuable insights:
Sigmoid Shape: Most Dose Response Curves are sigmoidal (S-shaped) when plotted on a semi-log scale.
Threshold Dose: The minimum concentration of drug needed to produce a detectable response.
Maximum Response (Emax): The plateau of the curve is where increasing the dose no longer increases the effect.
Potency (EC50): The concentration that produces 50% of the maximum response. A more potent drug requires a lower concentration to achieve the same effect.
Significance of the Dose Response Curve
Studying the Dose Response Curve is essential because it helps:
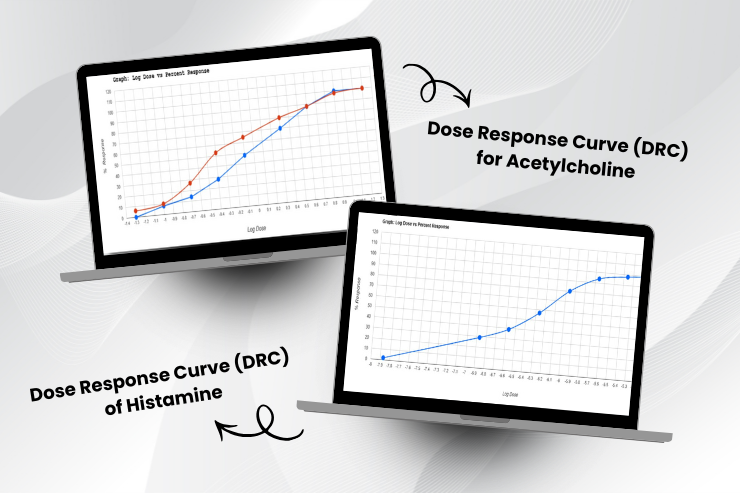
- Compare the potency and efficacy of different drugs (e.g., acetylcholine vs. histamine).
- Identify agonists and antagonists in receptor studies.
- Understand mechanisms of drug action and drug-receptor interactions.
- Design dosage regimens in clinical pharmacology.
Summary
| Parameter | Meaning |
|---|---|
| Threshold | Minimum concentration to elicit a response |
| Emax | Maximum possible effect |
| EC50 | Concentration producing 50% of maximum effect |
| Slope | Reflects drug sensitivity and receptor occupancy |
Conclusion
The Dose Response Curve is a cornerstone in experimental pharmacology. Using tissues like the frog rectus abdominis muscle, researchers can evaluate how drugs such as acetylcholine, adrenaline, histamine, barium chloride, and physostigmine interact with receptors and produce physiological responses.
This understanding not only advances pharmacological education but also guides the development of new and safer therapeutic agents.